Wolverine Pathways
The Wolverine Pathways program supports the recruitment and retention of students in the state of Michigan by offering programming and resources to underserved communities to assist in making the University of Michigan and higher education more obtainable. The Wolverine Pathways (WP) program is a free, year-round program that partners with the families, schools, and communities of Detroit, Southfield, Ypsilanti, and Grand Rapids school districts. This infographic reports on four key data points: (1) there have been 569 active scholars within the 2021-2022 academic years. (2) From the first five cohorts, 469 scholars have graduated from the program. (3) 81% of WP graduates enrolled in or graduated from college. 209 reported from U-M Ann Arbor and 60 at U-M Dearborn. (4) WP graduates are 2.1 times more likely to be admitted to U-M Ann Arbor and 2.4 times more likely to enroll as compared to students from the same high schools in the first four cohorts.
Click the image below to expand

The Wolverine Pathways program supports the recruitment and retention of students in the state of Michigan by offering programming and resources to underserved communities to assist in making the University of Michigan and higher education more obtainable. The Wolverine Pathways (WP) program is a free, year-round program that partners with the families, schools, and communities of Detroit, Southfield, Ypsilanti, and Grand Rapids school districts. This infographic reports on four key data points: (1) there have been 569 active scholars within the 2021-2022 academic years. (2) From the first five cohorts, 469 scholars have graduated from the program. (3) 81% of WP graduates enrolled in or graduated from college. 209 reported from U-M Ann Arbor and 60 at U-M Dearborn. (4) WP graduates are 2.1 times more likely to be admitted to U-M Ann Arbor and 2.4 times more likely to enroll as compared to students from the same high schools in the first four cohorts.
SuccessConnects
The SuccessConnects program is structured to improve student performance and increase the retention of underrepresented students attending the University of Michigan (Ann Arbor). The SuccessConnects program is a program for U-M students that offers mentorship and personal development from the first-day students arrive on campus. This infographic reports on five key data points: (1) the SuccessConnects program served 2,209 students during the first six years from 2016 through 2022. (2) The GPA gap between underrepresented minority students and majority students at U-M significantly decreased. (3) Compared to students from similar backgrounds who did not participate in the program, SuccessConnects students report (a) Higher GPAs, (b) greater sense of belonging at U-M, and (c) experience more positive psychological well-being.
Click the image below to expand

The SuccessConnects program is structured to improve student performance and increase the retention of underrepresented students attending the University of Michigan (Ann Arbor). The SuccessConnects program is a program for U-M students that offers mentorship and personal development from the first-day students arrive on campus. This infographic reports on five key data points: (1) the SuccessConnects program served 2,209 students during the first six years from 2016 through 2022. (2) The GPA gap between underrepresented minority students and majority students at U-M significantly decreased. (3) Compared to students from similar backgrounds who did not participate in the program, SuccessConnects students report (a) Higher GPAs, (b) greater sense of belonging at U-M, and (c) experience more positive psychological well-being.
Infrastructure
During the DEI 1.0 performance period, the University of Michigan has implemented new infrastructure toward addressing diversity, equity and inclusion efforts for all constituencies including students, faculty and staff. This infographic identifies four areas where the infrastructure needs have been positively impacted in support of DEI 1.0 efforts: (1) There are now 100-plus DEI Leads on the U-M campus and 120-plus DEI Leads at Michigan Medicine. (2) 100% of schools/colleges consider DEI in the faculty annual review process and 100% of units consider DEI in the staff performance review process. (3) The Trotter Multicultural Center has hosted 100-plus programs and workshops and have hosted 13,761 participants and guests from September 2020 through April 2022. (4) 27 senior faculty have been recognized for Diversity, Equity and Inclusion through scholarship, teaching, service or engagement.
Click the image below to expand

During the DEI 1.0 performance period, the University of Michigan has implemented new infrastructure toward addressing diversity, equity and inclusion efforts for all constituencies including students, faculty and staff. This infographic identifies four areas where the infrastructure needs have been positively impacted in support of DEI 1.0 efforts: (1) There are now 100-plus DEI Leads on the U-M campus and 120-plus DEI Leads at Michigan Medicine. (2) 100% of schools/colleges consider DEI in the faculty annual review process and 100% of units consider DEI in the staff performance review process. (3) The Trotter Multicultural Center has hosted 100-plus programs and workshops and have hosted 13,761 participants and guests from September 2020 through April 2022. (4) 27 senior faculty have been recognized for Diversity, Equity and Inclusion through scholarship, teaching, service or engagement.
DEI Skill Building
During the DEI 1.0 performance period, University of Michigan units have developed DEI Skill Building programs tailored to address the specific needs of students, faculty, and staff. This infographic provides four key statistics on DEI Skill Building impact during DEI 1.0 efforts: (1) 42,279 incoming undergraduates completed healthy relationship/bystander intervention training to reduce bias incidents. (2) 6,200-plus GSIs and Undergraduate Instructional Aides (IAs) completed modules on inclusive teaching. (3) 50,064 staff members participated in Organizational Learning and Michigan Medicine DEI educational sessions. (4) 1,850-plus faculty have attended Strategies and Tactics for Recruiting to Improve Diversity and Excellence (STRIDE) workshops.
Click the image below to expand

During the DEI 1.0 performance period, University of Michigan units have developed DEI Skill Building programs tailored to address the specific needs of students, faculty, and staff. This infographic provides four key statistics on DEI Skill Building impact during DEI 1.0 efforts: (1) 42,279 incoming undergraduates completed healthy relationship/bystander intervention training to reduce bias incidents. (2) 6,200-plus GSIs and Undergraduate Instructional Aides (IAs) completed modules on inclusive teaching. (3) 50,064 staff members participated in Organizational Learning and Michigan Medicine DEI educational sessions. (4) 1,850-plus faculty have attended Strategies and Tactics for Recruiting to Improve Diversity and Excellence (STRIDE) workshops.
Accessibility
DEI 1.0 efforts have continued to address the improvement of campus accessibility by addressing key areas of infrastructure, educational programs, and skills training. The University of Michigan identifies five areas where accessibility has been impacted: (1) More than one million dollars has been spent during DEI 1.0 on removing physical barriers to people with disabilities. (2) More than two thousand people have participated in disability awareness training and 90% confirmed that the skills gained applied to their work. (3) Action has been taken on 48 student IDEA (Inclusion, Diversity, Equity, and Accessibility) Board recommendations since 2020-21 and 14 have been implemented or sustainably achieved. (4) ITS and ECRT lead a multi-unit collaboration to develop IT accessibility SPG, making our campus commitment clear and accountable. (5) Adaptive sports and fitness programs, developed in 2020-2021, build awareness of and access to adaptive sports and fitness.
Click the image below to expand
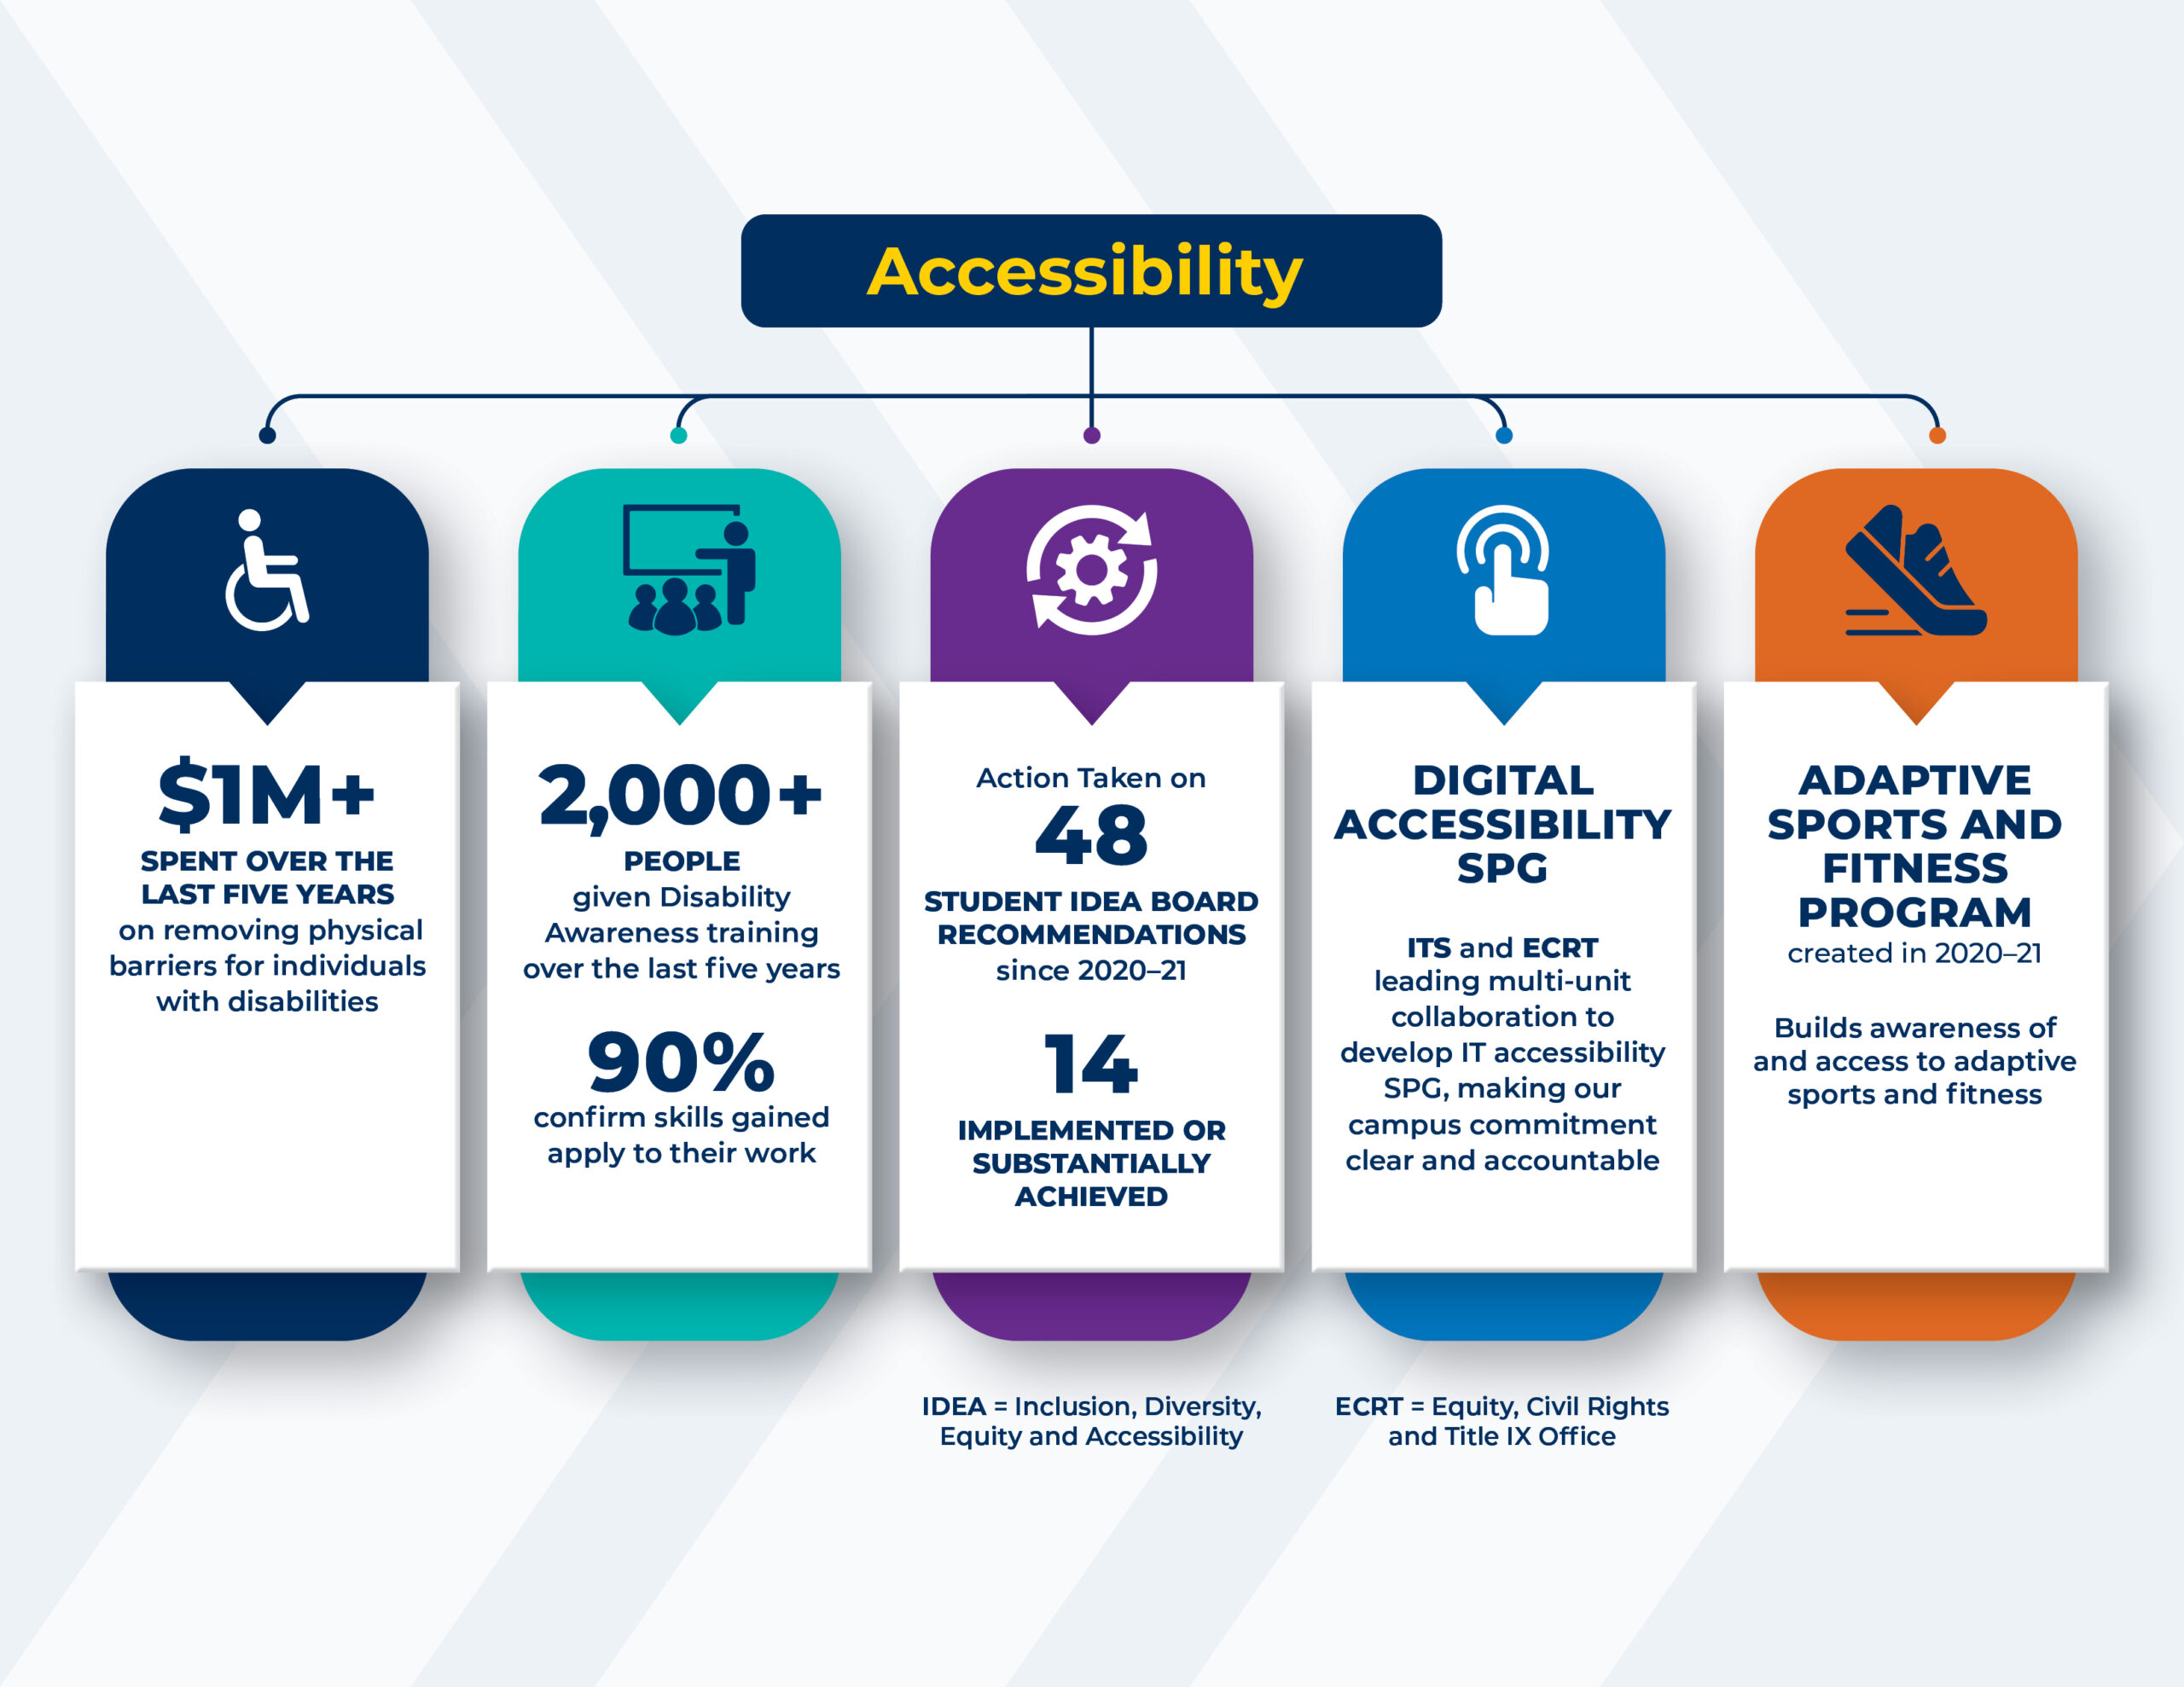
DEI 1.0 efforts have continued to address the improvement of campus accessibility by addressing key areas of infrastructure, educational programs, and skills training. The University of Michigan identifies five areas where accessibility has been impacted: (1) More than one million dollars has been spent during DEI 1.0 on removing physical barriers to people with disabilities. (2) More than two thousand people have participated in disability awareness training and 90% confirmed that the skills gained applied to their work. (3) Action has been taken on 48 student IDEA (Inclusion, Diversity, Equity, and Accessibility) Board recommendations since 2020-21 and 14 have been implemented or sustainably achieved. (4) ITS and ECRT lead a multi-unit collaboration to develop IT accessibility SPG, making our campus commitment clear and accountable. (5) Adaptive sports and fitness programs, developed in 2020-2021, build awareness of and access to adaptive sports and fitness.
Affordability & Socioeconomic Diversity at U-M
Affordability and Socioeconomic Diversity continue to improve as financial programs help to remove barriers for students who seek to attend the University of Michigan. Five key data points inform on the progress of Affordability and Socioeconomic Diversity at the University of Michigan: (1) In- and Out-of-state undergraduate Pell Grant recipients increased 32.3%, from 4,623 (16.0% of the undergraduate student population) to 6,118 (19.0%). (2) Domestic Rackham graduate student Pell Grant recipients increased 24.3% fFrom 1,373 (27.0% of the graduate student population) to 1,706 (29.7%). (3) The average Institutional Grant Aid is $14,800 per year for in-state students as part of the Go Blue Guarantee program. (4) 36% of in-state undergraduate students had their tuition covered by institutional grant aid. (5) The university reports a 20.8% increase in transfer students from two-year colleges.
Click the image below to expand

Affordability and Socioeconomic Diversity continue to improve as financial programs help to remove barriers for students who seek to attend the University of Michigan. Five key data points inform on the progress of Affordability and Socioeconomic Diversity at the University of Michigan: (1) In- and Out-of-state undergraduate Pell Grant recipients increased 32.3%, from 4,623 (16.0% of the undergraduate student population) to 6,118 (19.0%). (2) Domestic Rackham graduate student Pell Grant recipients increased 24.3% fFrom 1,373 (27.0% of the graduate student population) to 1,706 (29.7%). (3) The average Institutional Grant Aid is $14,800 per year for in-state students as part of the Go Blue Guarantee program. (4) 36% of in-state undergraduate students had their tuition covered by institutional grant aid. (5) The university reports a 20.8% increase in transfer students from two-year colleges.
LSA Collegiate Fellows
The LSA Collegiate Fellows program recruits early-career scholars in all liberal arts fields and prepares those scholars for possible tenure-track appointments in LSA, offering professional development opportunities through both LSA and the National Center for Institutional Diversity (NCID). The LSA Collegiate Fellows program recruits early-career scholars in all liberal arts fields and prepares those scholars for possible tenure-track appointments in LSA, offering professional development opportunities through both LSA and the National Center for Institutional Diversity (NCID). LSA Collegiate Fellows data reports on five cohorts from 2016 – 2021. Four data points provide an overview of the program impact: (1) 3,974 applications have been received. (2) 47 collegiate fellows have been hired in five cohorts. (3) 98% of fellows who have completed their fellowship are now in tenure-track positions. (4) 74% of LSA departments now have at least one fellow spanning natural sciences, social sciences, and humanities.
Click the image below to expand

The LSA Collegiate Fellows program recruits early-career scholars in all liberal arts fields and prepares those scholars for possible tenure-track appointments in LSA, offering professional development opportunities through both LSA and the National Center for Institutional Diversity (NCID). The LSA Collegiate Fellows program recruits early-career scholars in all liberal arts fields and prepares those scholars for possible tenure-track appointments in LSA, offering professional development opportunities through both LSA and the National Center for Institutional Diversity (NCID). LSA Collegiate Fellows data reports on five cohorts from 2016 – 2021. Four data points provide an overview of the program impact: (1) 3,974 applications have been received. (2) 47 collegiate fellows have been hired in five cohorts. (3) 98% of fellows who have completed their fellowship are now in tenure-track positions. (4) 74% of LSA departments now have at least one fellow spanning natural sciences, social sciences, and humanities.
Climate Survey
The Climate Survey data provides an overview of survey results provided to student, faculty and staff reporting on their perceptions of DEI 1.0 efforts. The Climate Survey data provides an overview of survey results provided to student, faculty and staff reporting on their perceptions of DEI 1.0 efforts. Four key metrics provide an overview of each constituencies responses to the Climate Survey: (1) When rating the satisfaction with the overall campus climate/environment over the past 12 months, the following indicates the percentage who reported being satisfied or very satisfied: students report 61%, staff report 59%, and faculty report 51%. (2) When reporting on perceptions of feeling discriminated against in the past 12 months, the following indicates the percentage who reported ‘yes’: students report 12%, staff report 16%, and faculty report 24%. (3) When reporting on the perceptions of mental health, the following indicates percentages reporting fair or poor: students report 42%, staff report 20%, and faculty report 20%. (4) When reporting on the perceptions of DEI progress since the start of the DEI plan, the following indicates the percentage reporting the same or much/somewhat better: students report 94%, staff report 92%, and faculty report 89%.
Click the image below to expand

The Climate Survey data provides an overview of survey results provided to student, faculty and staff reporting on their perceptions of DEI 1.0 efforts. The Climate Survey data provides an overview of survey results provided to student, faculty and staff reporting on their perceptions of DEI 1.0 efforts. Four key metrics provide an overview of each constituencies responses to the Climate Survey: (1) When rating the satisfaction with the overall campus climate/environment over the past 12 months, the following indicates the percentage who reported being satisfied or very satisfied: students report 61%, staff report 59%, and faculty report 51%. (2) When reporting on perceptions of feeling discriminated against in the past 12 months, the following indicates the percentage who reported ‘yes’: students report 12%, staff report 16%, and faculty report 24%. (3) When reporting on the perceptions of mental health, the following indicates percentages reporting fair or poor: students report 42%, staff report 20%, and faculty report 20%. (4) When reporting on the perceptions of DEI progress since the start of the DEI plan, the following indicates the percentage reporting the same or much/somewhat better: students report 94%, staff report 92%, and faculty report 89%.
Black, Indigenous and People of Color (BIPOC) at U-M
The infographic for Black, Indigenous and People of Color (BIPOC) at U-M provides data for five key areas within the faculty, staff, and student populations. BIPOC numbers include individuals who identify as American Indian or Alaska Native, Asian, Black or African American, Hispanic or Lationx, or Native Hawaiian or Other Pacific Islander, as well as individuals who self-identify with two or more races. The infographic for Black, Indigenous and People of Color (BIPOC) at U-M provides data for five key areas within the faculty, staff, and student populations. BIPOC numbers include individuals who identify as American Indian or Alaska Native, Asian, Black or African American, Hispanic or Latinx, or Native Hawaiian or Other Pacific Islander, as well as individuals who self-identify with two or more races. (1) BIPOC tenured or tenure-track faculty report a 12.3% increase in population (from 778 in 2016 to 874 in 2021). (2) BIPOC non-tenure track faculty report a 16.2% increase in population (from 961 in 2016 to 1,117 in 2021). (3) BIPOC staff report a 19.1% increase in population (from 6,745 in 2016 to 8,030 in 2021). (4) BIPOC undergraduate student enrollment reports a 37.8% increase (from 7,831 in 2016 to 10,791 in 2021). (5) BIPOC graduate and professional student enrollment report a 41.5% increase (from 3,224 in 2016 to 4,561 in 2021)
Click the image below to expand

The infographic for Black, Indigenous and People of Color (BIPOC) at U-M provides data for five key areas within the faculty, staff, and student populations. BIPOC numbers include individuals who identify as American Indian or Alaska Native, Asian, Black or African American, Hispanic or Lationx, or Native Hawaiian or Other Pacific Islander, as well as individuals who self-identify with two or more races. The infographic for Black, Indigenous and People of Color (BIPOC) at U-M provides data for five key areas within the faculty, staff, and student populations. BIPOC numbers include individuals who identify as American Indian or Alaska Native, Asian, Black or African American, Hispanic or Latinx, or Native Hawaiian or Other Pacific Islander, as well as individuals who self-identify with two or more races. (1) BIPOC tenured or tenure-track faculty report a 12.3% increase in population (from 778 in 2016 to 874 in 2021). (2) BIPOC non-tenure track faculty report a 16.2% increase in population (from 961 in 2016 to 1,117 in 2021). (3) BIPOC staff report a 19.1% increase in population (from 6,745 in 2016 to 8,030 in 2021). (4) BIPOC undergraduate student enrollment reports a 37.8% increase (from 7,831 in 2016 to 10,791 in 2021). (5) BIPOC graduate and professional student enrollment report a 41.5% increase (from 3,224 in 2016 to 4,561 in 2021)
Student Minoritized Representation
The Student Minoritized Representation infographic provides an overview of changes to the student population within seven key demographics over DEI 1.0. The Student Minoritized Representation infographic provides an overview of changes to the student population within seven key demographics over DEI 1.0. (1) Demographics for First-Generation students reports a 26.2% increase in undergraduate students (12.7% of U-M population in 2021). (2) Demographics for women reports a 14.5% increase in undergraduate students (51.2% of U-M population in 2021) and a 23.6% increase in graduate and professional students (50.6% of U-M population in 2021). (3) Demographics for Asian/Asian Americans report a 40% increase in undergraduate students (17% of U-M population in 2021) and a 34% increase in graduate and professional students (10.3% of U-M population in 2021). (4) Demographics for Black/African Americans report a 1% increase in undergraduate students (3.9% of U-M population in 2021) and a 41.7% increase in graduate and professional students (4.9% of U-M population in 2021). (5) Demographics for Hispanic or Latinx report a 57.7% increase in undergraduate students (7.3% of U-M population in 2021) and a 52.3% increase in graduate and professional students (6.6% of U-M population in 2021). (6) Demographics for Native Americans reports a 17.8% decrease in undergraduate students (0.1% of U-M population in 2021) and a 31.4% increase in graduate and professional students (0.3% of U-M population in 2021). (7) Demographics for Two or More Races reports a 47.4% increase in undergraduate students (5% of U-M population in 2021) and a 47.2% increase in graduate and professional students (3.3% of U-M population in 2021).
Click the image below to expand

The Student Minoritized Representation infographic provides an overview of changes to the student population within seven key demographics over DEI 1.0. The Student Minoritized Representation infographic provides an overview of changes to the student population within seven key demographics over DEI 1.0. (1) Demographics for First-Generation students reports a 26.2% increase in undergraduate students (12.7% of U-M population in 2021). (2) Demographics for women reports a 14.5% increase in undergraduate students (51.2% of U-M population in 2021) and a 23.6% increase in graduate and professional students (50.6% of U-M population in 2021). (3) Demographics for Asian/Asian Americans report a 40% increase in undergraduate students (17% of U-M population in 2021) and a 34% increase in graduate and professional students (10.3% of U-M population in 2021). (4) Demographics for Black/African Americans report a 1% increase in undergraduate students (3.9% of U-M population in 2021) and a 41.7% increase in graduate and professional students (4.9% of U-M population in 2021). (5) Demographics for Hispanic or Latinx report a 57.7% increase in undergraduate students (7.3% of U-M population in 2021) and a 52.3% increase in graduate and professional students (6.6% of U-M population in 2021). (6) Demographics for Native Americans reports a 17.8% decrease in undergraduate students (0.1% of U-M population in 2021) and a 31.4% increase in graduate and professional students (0.3% of U-M population in 2021). (7) Demographics for Two or More Races reports a 47.4% increase in undergraduate students (5% of U-M population in 2021) and a 47.2% increase in graduate and professional students (3.3% of U-M population in 2021).
Staff Minoritized Representation
The Staff Minoritized Representation infographic provides an overview of changes to the staff population within six key demographics over DEI 1.0. The Staff Minoritized Representation infographic provides an overview of changes to the staff population within six key demographics over DEI 1.0. (1) Demographics for women reports a 9.2% increase in staff (71.7% of U-M population in 2021). (2) Demographics for Asian/Asian Americans reports a 24.8% increase in staff (5.9% of U-M population in 2021). (3) Demographics for Black/African Americans reports a 91.6% increase in staff (10.7% of U-M population in 2021). (4) Demographics for Hispanics or Latinx report a 29.2% increase in staff (3.6% of U-M population in 2021). (5) Demographics for Native Americans report a 7.9% decrease in staff (0.2% of U-M population in 2021). (6) Demographics for Two or More Races reports a 32.8% increase in staff (2.3% of U-M population in 2021).
Click the image below to expand

The Staff Minoritized Representation infographic provides an overview of changes to the staff population within six key demographics over DEI 1.0. The Staff Minoritized Representation infographic provides an overview of changes to the staff population within six key demographics over DEI 1.0. (1) Demographics for women reports a 9.2% increase in staff (71.7% of U-M population in 2021). (2) Demographics for Asian/Asian Americans reports a 24.8% increase in staff (5.9% of U-M population in 2021). (3) Demographics for Black/African Americans reports a 91.6% increase in staff (10.7% of U-M population in 2021). (4) Demographics for Hispanics or Latinx report a 29.2% increase in staff (3.6% of U-M population in 2021). (5) Demographics for Native Americans report a 7.9% decrease in staff (0.2% of U-M population in 2021). (6) Demographics for Two or More Races reports a 32.8% increase in staff (2.3% of U-M population in 2021).
Faculty Minoritized Representation
The Faculty Minoritized Representation infographic provides an overview of changes to the faculty population within six key demographics over DEI 1.0. The Faculty Minoritized Representation infographic provides an overview of changes to the faculty population within six key demographics over DEI 1.0. (1) Demographics for women reports a 7.5% increase in tenured/tenure track faculty (36% of U-M population in 2021) and a 15.9% increase in non-tenure track faculty (51.4% of U-M population in 2021). (2) Demographics for Asian/Asian Americans report a 12.4% increase in tenured/tenure track faculty (12.4% of U-M population in 2021) and a 12.7% increase in non-tenure track faculty (15.3% of U-M population in 2021). (3) Demographics for Black/African Americans report an 8% increase in tenured/tenure track faculty (4.7% of U-M population in 2021) and a 23.1% increase in non-tenure track faculty (3.6% of U-M population in 2021). (4) Demographics for Hispanic or Latinx reports a 10.3% increase in tenured/tenure track faculty (4.1% of U-M population in 2021) and a 24.1% increase in non-tenure track faculty (3.7% of U-M population in 2021). (5) Demographics for Native Americans reports a 23.1% decrease in tenured/tenure track faculty (0.3% of U-M population in 2021) and a 50% increase in non-tenure track faculty (0.3% of U-M population in 2021). (6) Demographics for Two or More Races reports a 54.5% increase in tenured/tenure track faculty (1.6% of U-M population in 2021) and a 14.3% increase in non-tenure track faculty (1.4% of U-M population in 2021).
Click the image below to expand

The Faculty Minoritized Representation infographic provides an overview of changes to the faculty population within six key demographics over DEI 1.0. The Faculty Minoritized Representation infographic provides an overview of changes to the faculty population within six key demographics over DEI 1.0. (1) Demographics for women reports a 7.5% increase in tenured/tenure track faculty (36% of U-M population in 2021) and a 15.9% increase in non-tenure track faculty (51.4% of U-M population in 2021). (2) Demographics for Asian/Asian Americans report a 12.4% increase in tenured/tenure track faculty (12.4% of U-M population in 2021) and a 12.7% increase in non-tenure track faculty (15.3% of U-M population in 2021). (3) Demographics for Black/African Americans report an 8% increase in tenured/tenure track faculty (4.7% of U-M population in 2021) and a 23.1% increase in non-tenure track faculty (3.6% of U-M population in 2021). (4) Demographics for Hispanic or Latinx reports a 10.3% increase in tenured/tenure track faculty (4.1% of U-M population in 2021) and a 24.1% increase in non-tenure track faculty (3.7% of U-M population in 2021). (5) Demographics for Native Americans reports a 23.1% decrease in tenured/tenure track faculty (0.3% of U-M population in 2021) and a 50% increase in non-tenure track faculty (0.3% of U-M population in 2021). (6) Demographics for Two or More Races reports a 54.5% increase in tenured/tenure track faculty (1.6% of U-M population in 2021) and a 14.3% increase in non-tenure track faculty (1.4% of U-M population in 2021).
For additional detail, please see the Demographic Diversity section of the downloadable DEI 1.0 Evaluation Report.